Lexie Langella

Data-driven professional who loves solving problems. Cat mom.
View My LinkedIn Profile

Class is in Session
When I started public high school, the school was brand new. Only two grades, Freshmen and Sophomore. Everyone was discovering the ins and outs of learning or teaching in this brand new school. Class sizes were smaller with not a lot of diversity. My experience was very different than the well established high schools that had history and traditions. The data set I analyzed for this project doesn’t show how old each school is, but I learned other characteristics.
For this project, the goal was to answer three questions for the Massachusetts superintendent:
- Which schools are struggling the most?
- How does class size effect college admission?
- What are the top math schools in the state?
The Data
This data set comes from the Massachusetts Department of Education and was last updated in 2017. I gleaned insights from 1,862 rows of data which translates to 1,862 schools and cleaned the data by removing any duplicates.
You can find the data set here.
Then I uploaded the data into Tableau in order to visualize the data. I created a bar chart, scatter plot, and line graph which can be found at my dashboard here
From this I learned:
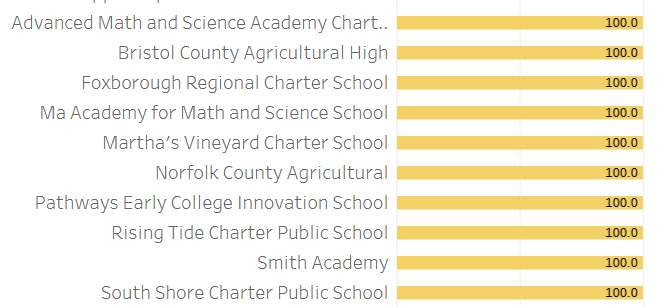
- Only 10 schools acheived 100% graduation rate
- The higher the class size, the more likely those students graduate and attend college
- 4 schools met the passing threshold for math scores for the 4th grade
Analysis
Graduation Percentage
Out of 1,862 schools, the schools shown below have the lowest graduation percentage. They all have lower than 20% graduation rate.
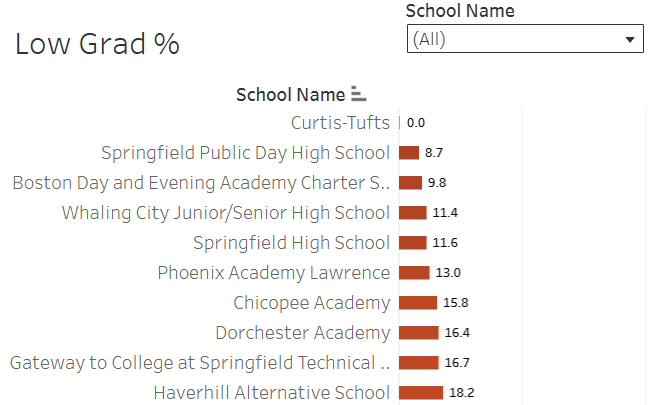
There is one school that is an outlier. The Curtis-Tufts High School is an alternative school that teaches special needs students. They provide smaller class sizes and a more individualized education program. They have a 0% graduation rate since any graduating students receive a Medford High School diploma.
Below are the top 10 schools with 100% graduation rate.
Class Size and College Attendance
The scatter plot shows the percent of students who attended college based on class size. The majority of schools had between 10 and 20 students in their class. There are outliers in both directions where some schools had fewer than 10 in class some had more than 20. The trend line indicates that the more students you have in class, the more likely it is that students will graduate and go to college.
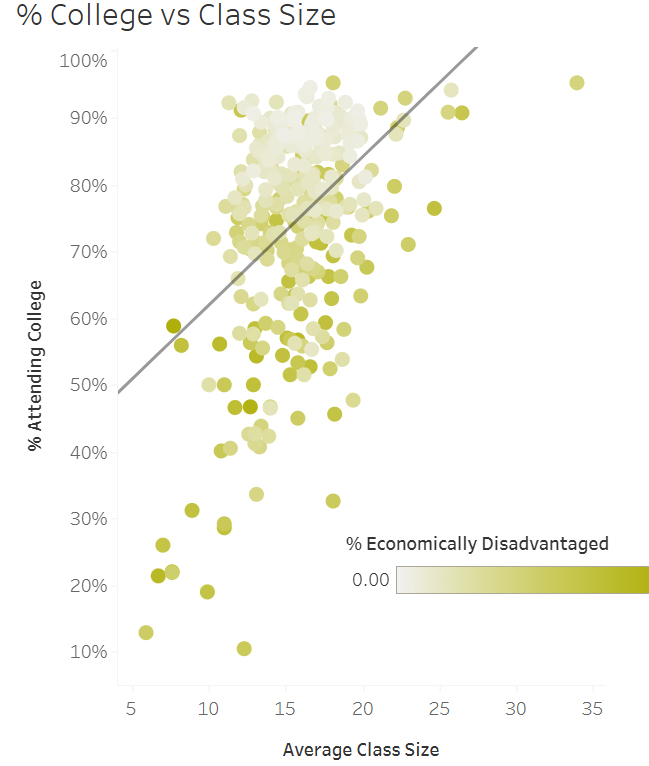
The darker the dots are on this scatter plot, the more economically disadvantaged the students are in that class. There are more darker dots below the trend line and especially with lower class size numbers. If class size is a factor in a student not going to college, then adding more students in a class could give more opportunties for students to be motivated by their peers to go to college if they so choose.
4th Grade Math
The Secretary of Education believes math scores are an indication of a school’s success rate. So by looking at math scores from the 4th grade, we can see which schools’ teaching methods are successful and which need more work.
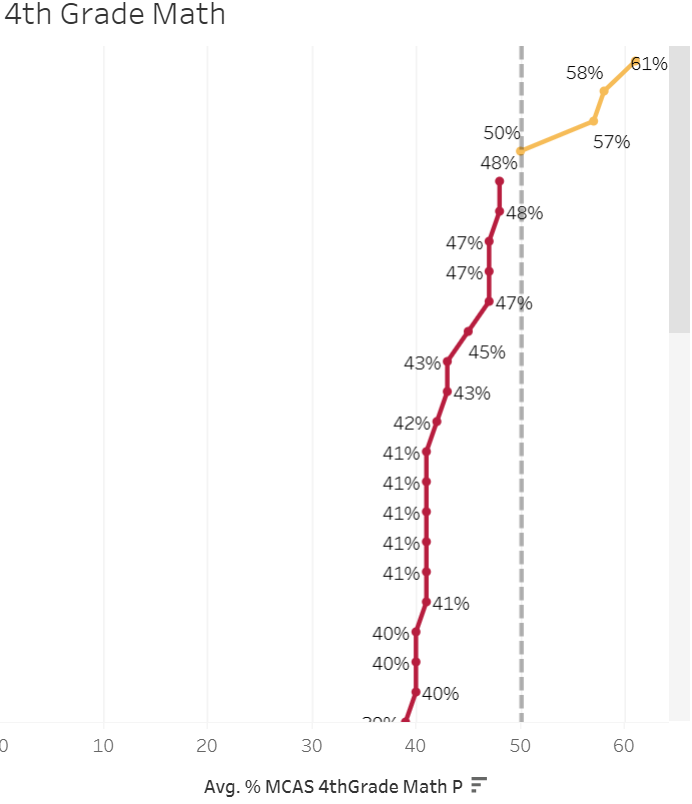
The passing threshold percentage of averaged math scores is 50% so as this line graph shows, there were only 4 schools that met the criteria. It would be interesting to see which of these 4 elementary schools feed into middle schools and eventually high schools. Do these elementary schools with the higher math scores have the same students who eventually attend the high schools that have the highest graduation percentage?
Takeaways
From this data, I answered three questions: which schools are struggling the most, how does class size effect college admission, and what are the top math schools in the state. My Tableau dashboard showed the names of the 10 schools that received a 100% graduation rate and those that had the lowest graduation rate, the higher the class size the more likely a student is to graduate, and a list of the 4 elementary schools that met the passing threshold for 4th grade math.
This project was my first to use data in Tableau and create a dashboard. If you would like to hear me summarize this project, you can find my Loom video here. If you have any questions or would like to connect, please reach out to me on LinkedIn.